#290 産業別物質収支図を作成する/Creating Material Balance Diagrams by Industry
An English translation of this article is provided at the bottom of the page.
前回の投稿では、2015年大阪府全体のマテリアルフロー図を作成しました。
今回の投稿では、天野ら(1999)を参考に2015年大阪府内の製造業における産業別物質収支図を作成します。
産業別物質収支図について
天野ら(1999)が作成した滋賀県内の産業別物質収支図は以下のようになります。
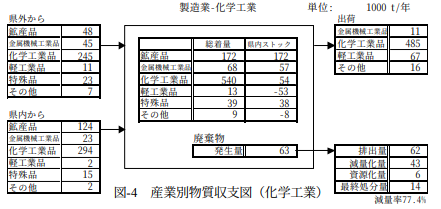
図290−1 産業別物質収支図(化学工業)(天野ら(1999)より引用)
最初に、以下のようなテンプレートとなるExcelシートを用意します。
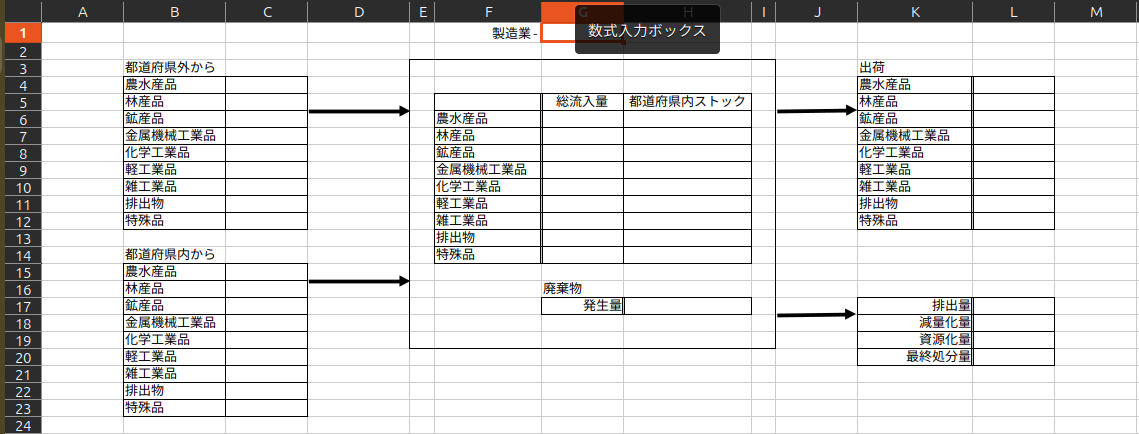
図290−2 産業別物質収支図のテンプレート
後述するPythonコードを実行することで、赤枠のセル(セルG1)には作成対象となる各産業名が入力されます。
「都道府県外から」は各産業への純流入量が、「都道府県内から」は、各産業の内部流動量が、「出荷」は各産業からの総流出量が、「都道府県内ストック」は「総流入量」から「出荷」を差し引いた値がそれぞれ入力されます。
天野ら(1999)は滋賀県を対象としているため、「県外から」「県内から」という表記になっています。一方、本投稿では、今後他都道府県へ対象を拡大することを見越して、「都道府県外から」「都道府県内から」という表記を用いています。
また、天野ら(1999)では海に面していない滋賀県を対象とし、輸出入を考慮に入れる必要がないために「総着量」となっています。一方、本投稿で対象とする大阪府は輸出入を考慮に入れる必要があり、「総流入量」および「出荷」(=総流出量)を計上しています。
産業別物質収支図を作成する
以下のコードを実行すると、都道府県の製造業における各産業の物質収支図をテンプレートを元に作成できます。
import os
import shutil
import pandas as pd
import openpyxl

# 0. 準備
folder = f"大阪府産業別物質収支"
os.makedirs(folder, exist_ok=True)

# アップロードされた略称対応表を読み込み
# industry列をキーにした辞書に変換
df_abbr = pd.read_csv('製造業における産業名と略称の対応表.csv')
abbr_dict = dict(zip(df_abbr['industry'], df_abbr['abbreviation']))

# 廃棄物データの読み込み(略称をインデックスにする)
df_waste = pd.read_csv('業種別産業廃棄物排出量.csv', index_col=0)
# 数値データに含まれるカンマやスペースを除去して数値化
for col in df_waste.columns:
    df_waste[col] = pd.to_numeric(df_waste[col].astype(str).str.replace(',', '').str.strip(), errors='coerce').fillna(0)

# --- 計算用データの事前整備 ---
# 数値として扱える列のみ抽出し、数値型に強制変換(2015年版の型エラー対策)
df_numeric = df_chaku_item_to_industry.apply(pd.to_numeric, errors='coerce').fillna(0)
item_totals = df_numeric.sum(axis=0)

# 比率計算(ゼロ除算を避けるために fillna(0) を適用)
dist_ratio_internal = (df_agg_year_pref_item['内部流動量'] / item_totals).fillna(0)
dist_ratio_netin    = (df_agg_year_pref_item['純流入量']   / item_totals).fillna(0)
dist_ratio_out      = (df_agg_year_pref_item['総流出量']   / item_totals).fillna(0)

# 対象とする品類インデックス
target_index = ['農水産品','林産品','鉱産品','金属機械工業品','化学工業品','軽工業品','雑工業品','排出物','特殊品']
template_file = "産業別物質収支図テンプレート.xlsx"

# 書き込み位置の定義
start_positions = {
    'outside': (4, 3),   'internal': (15, 3),
    'total': (6, 7),     'stock': (6, 8),
    'shipment': (4, 12),
    # 廃棄物データの書き込み位置(テンプレートの構成に基づき設定)
    'waste': {
        '発生量': (17, 8),
        '排出量': (17, 12),
        '減量化量': (18, 12),
        '資源化量': (19, 12),
        '最終処分量': (20, 12)
    }
}

# 1. 業種ごとにループ
for targetind in df_manu_value.index:
    try:
        # --- A. データ計算 ---
        if targetind not in df_numeric.index:
            continue

        # 略称を取得(対応表になければ元の名前を使用)
        short_name = abbr_dict.get(targetind, targetind)

        target_data = df_numeric.loc[targetind]

        # DataFrameの作成
        df_calc = pd.DataFrame({
            'goods': df_item_to_goods['goods'],
            'total': target_data,
            'internal': target_data * dist_ratio_internal,
            'outside': target_data * dist_ratio_netin,
            'shipment': target_data * dist_ratio_out
        })

        # 集計と並び替え
        res = df_calc.groupby('goods').sum().reindex(target_index).fillna(0.0)
        res['stock'] = (res['total'] - res['shipment']).round(1)

        # --- B. 保存処理 ---
        # ファイル名を略称にして短くする
        new_file_name = f"{folder}/{time}_{short_name}_物質収支図.xlsx"
        shutil.copy(template_file, new_file_name)

        wb = openpyxl.load_workbook(new_file_name)
        ws = wb.active

        # セルG1に各産業名(短縮名称)を転記
        ws.cell(row=1, column=7, value=short_name)
        for i, goods_name in enumerate(target_index):
            row_data = res.loc[goods_name]

            # 各列の書き込み
            ws.cell(row=start_positions['outside'][0] + i,  column=start_positions['outside'][1],  value=round(row_data['outside'], 1))
            ws.cell(row=start_positions['internal'][0] + i, column=start_positions['internal'][1], value=round(row_data['internal'], 1))
            ws.cell(row=start_positions['total'][0] + i,    column=start_positions['total'][1],    value=round(row_data['total'], 1))
            ws.cell(row=start_positions['stock'][0] + i,    column=start_positions['stock'][1],    value=round(row_data['stock'], 1))
            ws.cell(row=start_positions['shipment'][0] + i, column=start_positions['shipment'][1], value=round(row_data['shipment'], 1))
        # 2. 廃棄物データの書き込み(新規追加)
        if short_name in df_waste.index:
            waste_data = df_waste.loc[short_name]
            for item, pos in start_positions['waste'].items():
                ws.cell(row=pos[0], column=pos[1], value=round(waste_data[item], 1))
        wb.save(new_file_name)
        wb.close()

        print(f"✅ 作成完了: {targetind}")

    except Exception as e:
        print(f"❌ {targetind} でエラーが発生: {e}")

print(f"\n✨ {time}年版のすべての処理が終了しました。")
上記のコードを実行して作成された食料品の物質収支図を以下に掲示します。管理人のパソコンのOSがUbuntuであるためか、上記のコードを実行しても、Excelのテンプレートシートにあった矢印が各産業別物質収支図に反映されないのが残念なところです。
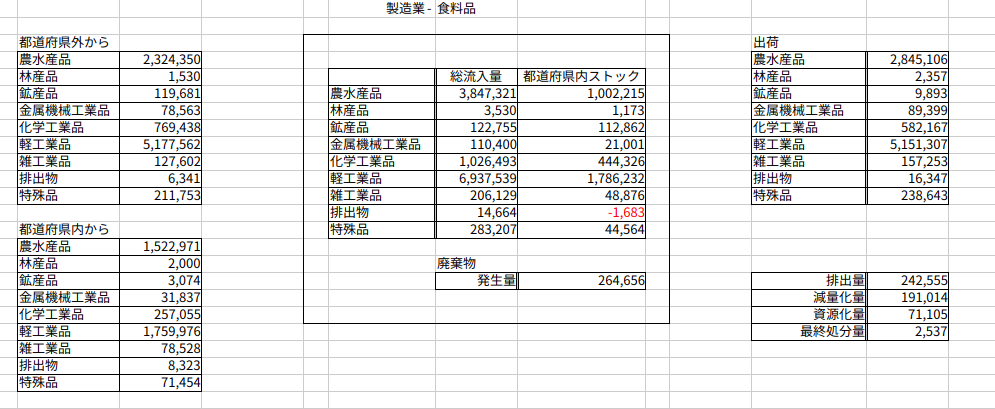
図290−3 産業別物質収支図(2015年大阪府食料品)
引用文献・参考文献
English Translation
In the previous post, I created a material flow diagram for the entire Osaka Prefecture in 2015.
In this post, I will create material balance diagrams by industry for the manufacturing sector in Osaka Prefecture for 2015, referring to the methodology of Amano et al. (1999).
About the Material Balance Diagram by Industry
The material balance diagram by industry for Shiga Prefecture created by Amano et al. (1999) is shown below.
Figure 290-1: Material Balance Diagram by Industry (Chemical Industry) (Cited from Amano et al. (1999))
Figure 290-1: Material Balance Diagram by Industry (Chemical Industry) (Cited from Amano et al. (1999))
First, I prepared an Excel sheet to serve as the following template.
Figure 290-2: Template for Material Balance Diagram by Industry
By running the Python code described later, the name of each target industry is entered into the cell marked with a red frame (Cell G1).
The following values are populated: "From outside the prefecture" represents the net inflow to each industry; "From within the prefecture" represents the internal flow within each industry; "Shipments" represents the total outflow from each industry; and "Intra-prefectural stock" is calculated by subtracting "Shipments" from "Total Inflow."
Furthermore, Amano et al. (1999) targeted Shiga Prefecture, which is landlocked and does not need to account for imports and exports; therefore, they used the term "Total Arrival Volume (Sochaku-ryo)." In contrast, Osaka Prefecture, the subject of this post, requires the consideration of imports and exports, so I have recorded "Total Inflow" and "Shipments" (= Total Outflow).
Creating the Material Balance Diagrams by Industry
By running the following code, you can create material balance diagrams for each industry in the manufacturing sector of a prefecture based on the template.
import os
import shutil
import pandas as pd
import openpyxl

# 0. Preparation
folder = f"Osaka_Material_Balance_by_Industry"
os.makedirs(folder, exist_ok=True)

# Load the industry name to abbreviation mapping table
# Convert to a dictionary with 'industry' as the key
df_abbr = pd.read_csv('製造業における産業名と略称の対応表.csv')
abbr_dict = dict(zip(df_abbr['industry'], df_abbr['abbreviation']))

# Load waste data (using abbreviations as index)
df_waste = pd.read_csv('業種別産業廃棄物排出量.csv', index_col=0)
# Remove commas and spaces from numeric data and convert to numeric type
for col in df_waste.columns:
    df_waste[col] = pd.to_numeric(df_waste[col].astype(str).str.replace(',', '').str.strip(), errors='coerce').fillna(0)

# --- Data Pre-processing for Calculation ---
# Extract only columns that can be handled as numeric and force conversion (to prevent type errors in the 2015 version)
df_numeric = df_chaku_item_to_industry.apply(pd.to_numeric, errors='coerce').fillna(0)
item_totals = df_numeric.sum(axis=0)

# Calculate distribution ratios (apply fillna(0) to avoid division by zero)
dist_ratio_internal = (df_agg_year_pref_item['内部流動量'] / item_totals).fillna(0)
dist_ratio_netin    = (df_agg_year_pref_item['純流入量']   / item_totals).fillna(0)
dist_ratio_out      = (df_agg_year_pref_item['総流出量']   / item_totals).fillna(0)

# Target category index
target_index = ['農水産品','林産品','鉱産品','金属機械工業品','化学工業品','軽工業品','雑工業品','排出物','特殊品']
template_file = "産業別物質収支図テンプレート.xlsx"

# Define writing positions
start_positions = {
    'outside': (4, 3),   'internal': (15, 3),
    'total': (6, 7),     'stock': (6, 8),
    'shipment': (4, 12),
    # Writing positions for waste data (set based on template structure)
    'waste': {
        '発生量': (17, 8),
        '排出量': (17, 12),
        '減量化量': (18, 12),
        '資源化量': (19, 12),
        '最終処分量': (20, 12)
    }
}

# 1. Loop through each industry sector
for targetind in df_manu_value.index:
    try:
        # --- A. Data Calculation ---
        if targetind not in df_numeric.index:
            continue

        # Get abbreviation (use the original name if not in the mapping table)
        short_name = abbr_dict.get(targetind, targetind)

        target_data = df_numeric.loc[targetind]

        # Create DataFrame
        df_calc = pd.DataFrame({
            'goods': df_item_to_goods['goods'],
            'total': target_data,
            'internal': target_data * dist_ratio_internal,
            'outside': target_data * dist_ratio_netin,
            'shipment': target_data * dist_ratio_out
        })

        # Aggregation and reordering
        res = df_calc.groupby('goods').sum().reindex(target_index).fillna(0.0)
        res['stock'] = (res['total'] - res['shipment']).round(1)

        # --- B. Export Process ---
        # Use abbreviation for a shorter filename
        new_file_name = f"{folder}/{time}_{short_name}_Material_Balance_Diagram.xlsx"
        shutil.copy(template_file, new_file_name)

        wb = openpyxl.load_workbook(new_file_name)
        ws = wb.active

        # Write each industry name (abbreviated) to cell G1
        ws.cell(row=1, column=7, value=short_name)
        for i, goods_name in enumerate(target_index):
            row_data = res.loc[goods_name]

            # Write data to each column
            ws.cell(row=start_positions['outside'][0] + i,  column=start_positions['outside'][1],  value=round(row_data['outside'], 1))
            ws.cell(row=start_positions['internal'][0] + i, column=start_positions['internal'][1], value=round(row_data['internal'], 1))
            ws.cell(row=start_positions['total'][0] + i,    column=start_positions['total'][1],    value=round(row_data['total'], 1))
            ws.cell(row=start_positions['stock'][0] + i,    column=start_positions['stock'][1],    value=round(row_data['stock'], 1))
            ws.cell(row=start_positions['shipment'][0] + i, column=start_positions['shipment'][1], value=round(row_data['shipment'], 1))

        # 2. Write waste data (New Addition)
        if short_name in df_waste.index:
            waste_data = df_waste.loc[short_name]
            for item, pos in start_positions['waste'].items():
                ws.cell(row=pos[0], column=pos[1], value=round(waste_data[item], 1))

        wb.save(new_file_name)
        wb.close()

        print(f"✅ Completed: {targetind}")

    except Exception as e:
        print(f"❌ Error occurred in {targetind}: {e}")

print(f"\n✨ All processes for the {time} edition have been completed.")
The material balance diagram for "Food Products" created by running the above code is shown below. Unfortunately, perhaps because my computer's OS is Ubuntu, the arrows that were in the Excel template sheet were not reflected in the industry-specific material balance diagrams after running the code.
Figure 290-3: Material Balance Diagram by Industry (2015 Osaka Prefecture, Food Products)
References
Follow me!


“#290 産業別物質収支図を作成する/Creating Material Balance Diagrams by Industry” に対して1件のコメントがあります。