#289 都道府県全体のマテリアルフロー図を作成する/Constructing a Material Flow Chart for Entire Prefectures
An English translation of this article is provided at the bottom of the page.
投稿#276から、都道府県全体のマテリアルフローを推計するコードの改善に取り組んできました。
今回の投稿では、改善したコードから算出した都道府県全体のマテリアルフローをマテリアルフロー図にしていくコードを作成します。
マテリアルフロー図の元になるExcelシートを用意
まず、以下のようなマテリアルフロー図の元になるExcelシートを用意します。
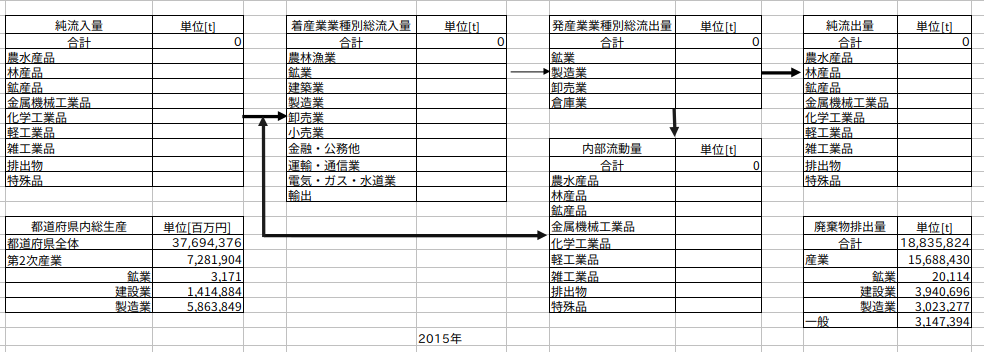
図289−1 マテリアルフローテンプレート
都道府県内総生産と廃棄物排出量については、事前に値を入力してあります。
純流入量、総流入量、総流出量、純流入量、内部流動量の各値を入力するコード
上記のシートに純流入量、総流入量、総流出量、純流入量、内部流動量の各値を入力するコードが以下のようになります。
import pandas as pd
import shutil # ファイルコピー用のライブラリ

# 1. 設定:元ファイルと新しいファイル名
template_file = "2015年マテリアルフローテンプレート.xlsx"

# 保存したい新しい名前を指定
new_file_name = f"{time}年マテリアルフロー.xlsx"

# 2. 書き込み前にファイルをコピーする
try:
    shutil.copy(template_file, new_file_name)
    print(f"📄 テンプレートをコピーしました: {new_file_name}")

    # 以降、書き込み先をコピーしたファイル(new_file_name)にする
    SHEET_NAME = 'Sheet1'

    print(f"書き込む行数: {len(df_goods_netinflow)}")
    print(df_goods_netinflow.head()) # 中身が表示されるか

    with pd.ExcelWriter(
        new_file_name,       # ここをコピー後のファイル名に変更
        engine='openpyxl',
        mode='a',
        if_sheet_exists='overlay'
    ) as writer:

        # 純流入量を書き込む
        df_goods_netinflow.to_excel(
            writer,
            sheet_name=SHEET_NAME,
            startrow=4, # 開始行を指定 (0から数える)
            startcol=2, # 開始列を指定 (0から数える)
            index=False, # DataFrameの行番号(index)は書き込まない
            header=False # DataFrameの列名(header)は書き込む
        )

        # 着産業業種別総流入量を書き込む
        df_sector_chaku.to_excel(
            writer,
            sheet_name=SHEET_NAME,
            startrow=4, # 開始行を指定 (0から数える)
            startcol=5, # 開始列を指定 (0から数える)
            index=False, # DataFrameの行番号(index)は書き込まない
            header=False # DataFrameの列名(header)は書き込む
        )

        # 発産業業種別総流出量を書き込む
        df_sector_hatsu.to_excel(
            writer,
            sheet_name=SHEET_NAME,
            startrow=4, # 開始行を指定 (0から数える)
            startcol=8, # 開始列を指定 (0から数える)
            index=False, # DataFrameの行番号(index)は書き込まない
            header=False # DataFrameの列名(header)は書き込む
        )

        # 純流出量を書き込む
        df_goods_netoutflow.to_excel(
            writer,
            sheet_name=SHEET_NAME,
            startrow=4, # 開始行を指定 (0から数える)
            startcol=11, # 開始列を指定 (0から数える)
            index=False, # DataFrameの行番号(index)は書き込まない
            header=False # DataFrameの列名(header)は書き込む
        )

        # 内部流動量を書き込む
        df_goods_internalflow.to_excel(
            writer,
            sheet_name=SHEET_NAME,
            startrow=12, # 開始行を指定 (0から数える)
            startcol=8, # 開始列を指定 (0から数える)
            index=False, # DataFrameの行番号(index)は書き込まない
            header=False # DataFrameの列名(header)は書き込む
        )

    print(f"✅ データを '{new_file_name}' に保存しました。")

except FileNotFoundError:
    print(f"❌ テンプレートファイル '{template_file}' が見つかりません。")
except Exception as e:
    print(f"❌ エラーが発生しました: {e}")
上記のコードを実行して作成した2015年大阪府のマテリアルフローが以下の図になります。
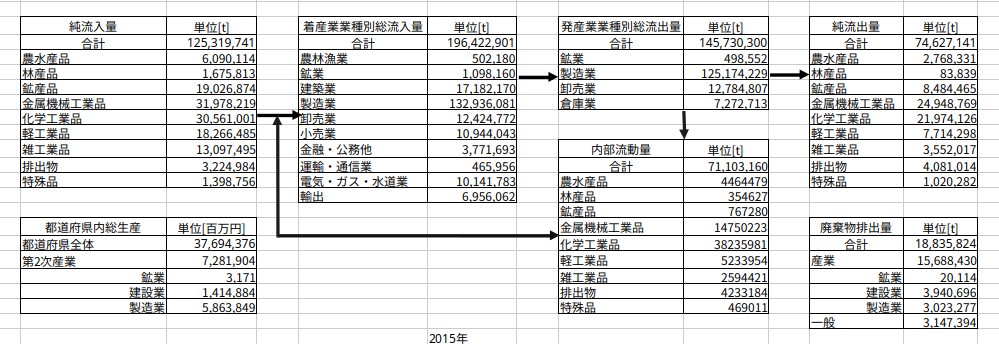
図289-2 2015年大阪府マテリアルフロー
引用文献・参考文献
- 天野 耕二, 戸辺 勝俊, 長谷川 聖洋, 日本全国の都道府県における物質循環評価手法に関する研究, 環境システム研究論文集, 2001, 29 巻, p. 215-223
- 島崎 洋一, 物流センサスによる山梨県のマテリアルフローの時系列分析, 環境科学会誌, 2008, 21 巻, 1 号, p. 27-36
The English version is available below.
Since Post #276, I have been working on improving the code used to estimate material flows for entire prefectures.
In this post, I will create code to generate a Material Flow diagram based on the material flow values calculated with the improved code.
Preparing the Source Excel Sheet for the Material Flow Diagram
First, prepare an Excel sheet that will serve as the basis for the material flow diagram, as shown below.
Figure 289-1: Template of Material Flow Diagram
Values for the Gross Prefectural Product and the amount of waste generated have been entered in advance.
The following code enters the values for Net Inflow, Total Inflow, Total Outflow, and Internal Flow into the sheet mentioned above.
import pandas as pd
import shutil # Library for file copying

# 1. Configuration: Source file and new filename
template_file = "2015年マテリアルフローテンプレート.xlsx"
# Specify the new name for the output file
new_file_name = f"{time}年マテリアルフロー.xlsx"

# 2. Copy the file before writing
try:
    shutil.copy(template_file, new_file_name)
    print(f"📄 Copied template to: {new_file_name}")

    # Set the destination to the copied file (new_file_name)
    SHEET_NAME = 'Sheet1'

    print(f"Number of rows to write: {len(df_goods_netinflow)}")
    print(df_goods_netinflow.head()) # Check content

    with pd.ExcelWriter(
        new_file_name,       # Change to the copied filename
        engine='openpyxl',
        mode='a',
        if_sheet_exists='overlay'
    ) as writer:

        # Write Net Inflow
        df_goods_netinflow.to_excel(
            writer,
            sheet_name=SHEET_NAME,
            startrow=4,  # Specify start row (0-indexed)
            startcol=2,  # Specify start column (0-indexed)
            index=False, # Do not write DataFrame index
            header=False # Do not write DataFrame header
        )

        # Write Total Inflow by Industry (Destination Sector)
        df_sector_chaku.to_excel(
            writer,
            sheet_name=SHEET_NAME,
            startrow=4,
            startcol=5,
            index=False,
            header=False
        )

        # Write Total Outflow by Industry (Origin Sector)
        df_sector_hatsu.to_excel(
            writer,
            sheet_name=SHEET_NAME,
            startrow=4,
            startcol=8,
            index=False,
            header=False
        )

        # Write Net Outflow
        df_goods_netoutflow.to_excel(
            writer,
            sheet_name=SHEET_NAME,
            startrow=4,
            startcol=11,
            index=False,
            header=False
        )

        # Write Internal Flow
        df_goods_internalflow.to_excel(
            writer,
            sheet_name=SHEET_NAME,
            startrow=12,
            startcol=8,
            index=False,
            header=False
        )

    print(f"✅ Data successfully saved to '{new_file_name}'.")

except FileNotFoundError:
    print(f"❌ Template file '{template_file}' not found.")
except Exception as e:
    print(f"❌ An error occurred: {e}")
Here is the
Figure.289-2 2015 Material Flow diagram for Osaka Prefecture
Citations and References
Follow me!


“#289 都道府県全体のマテリアルフロー図を作成する/Constructing a Material Flow Chart for Entire Prefectures” に対して1件のコメントがあります。