#297 2020年大阪府マテリアルフローの推計/Estimation of Material Flow in Osaka Prefecture, 2020
An English translation of this article is provided at the bottom of the page.
前回の投稿から、他年度における大阪府のマテリアルフロー推計に取り組んでいます。今回は2020年における大阪府のマテリアルフローを推計します。
2015年推計と比較した際の、2020年推計における相違点として以下の点が挙げられます。
-
2015年の物流センサスでは、エクセルファイル「都道府県間年間流動量」から内部流動量のデータを取得できました。図297−1 都道府県間年間流動量(年間品類別)で説明すると、北海道における農林水産品の年間流動量は、行「着都道府県」の北海道と、列「着都道府県」の北海道が交差したところ(青枠の部分)になります。一方、2020年の物流センサスでは、年間品類別データが「都道府県・品類別年間出荷量」と「都道府県・品類別年間入荷量」というように2つのエクセルファイルに分けられており、内部流動量のデータファイルは存在しませんでした。2020年の内部流動量については、「都道府県間流動量(品類別)」から3日間の内部流動量のデータが存在します。したがって、「都道府県・品類別年間入荷量」の年間品類別出荷量(着量に該当)に、3日間の品類別着量に対する3日間の内部流動量の割合を乗じることで年間品類別の内部流動量を算出しました。
$$
年間品類別内部流動量 = 年間品類別出荷量 × 3日間品類別内部流動量 / 3日間品類別出荷量
$$
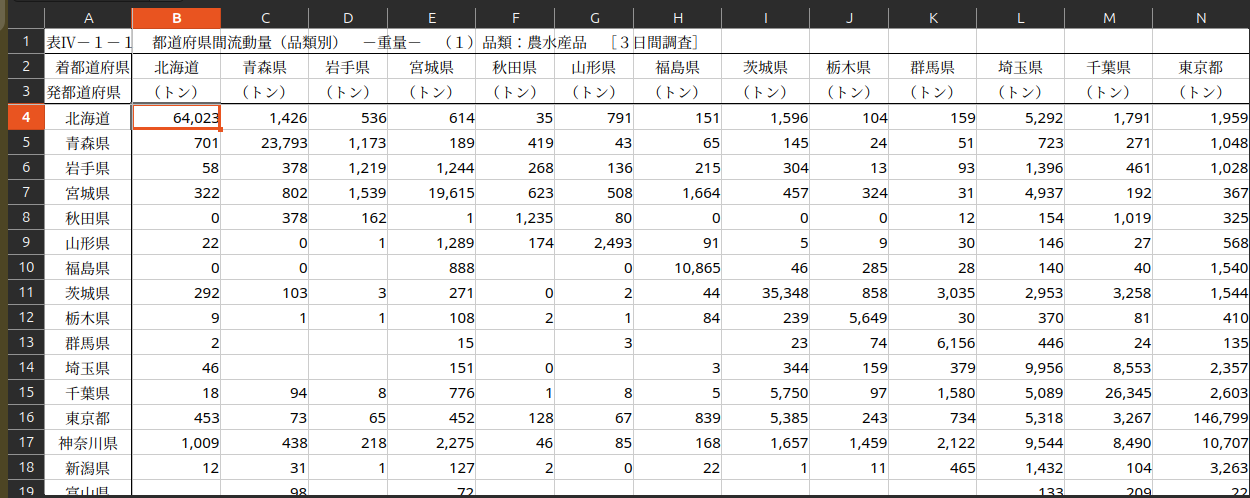
図297−1 都道府県間年間流動量(年間品類別) -
2015年の物流センサスでは、品目別の流動量について、1つのエクセルシートに全ての品目の流動量が格納されていました。一方、2020年では品目ごとにシートが分かれていました。
-
「発産業業種・品類品目別流動量」および「着産業業種・品類品目別流動量」を大阪府の産業構造や取引状況を反映させるために、発産業は原材料・燃料・電力の使用額等を、着産業は製造品出荷額等を参照し、重みづけによる補正を行う必要があります。原材料・燃料・電力の使用額等と製造品出荷額等のデータは、「経済センサス‐活動調査 / 経済センサス‐活動調査 / 事業所に関する集計 産業別集計 製造業に関する集計」から取得します。その際、平成28年経済センサスでは、APIを叩くと図297−2のようなデータが得られます。一方、令和3年経済センサスでは、APIを叩くと図297−3のように「2020000000_2020_09_食料品製造業_00_全国計」というように、産業名に年度コードや地域コード、地域名が余計な文字列が格納された行名が入ったデータが返ってきます。したがって、2020年の推計では、それらの余計な文字列を除去する処理をコードに盛り込む必要がありました。

図297−2 平成28年経済センサス‐活動調査 / 事業所に関する集計 産業別集計 製造業に関する集計
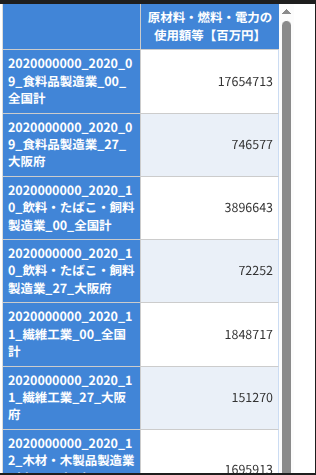
図297−3 令和3年経済センサス‐活動調査 / 事業所に関する集計 産業別集計 製造業に関する集計
2020年大阪府マテリアルフロー
2020年大阪府のマテリアルフローの推計結果は以下のようになります。
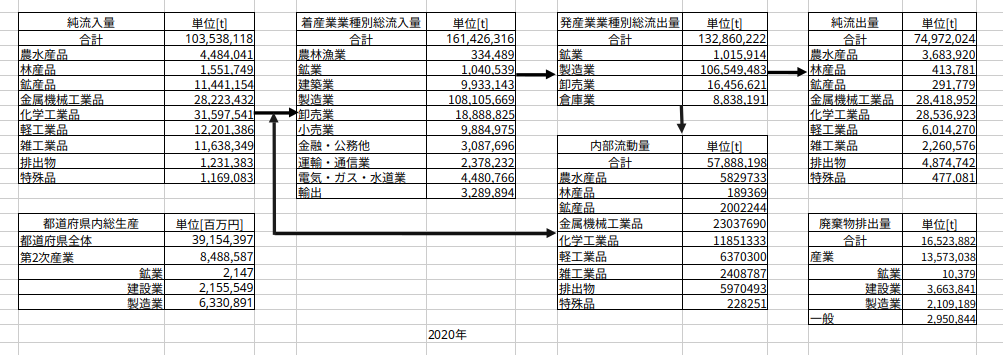
図297−4 2020年大阪府マテリアルフロー
物質循環の指標については、2000年から2020年の過去20年での算出が全て終わった段階で一覧表にする形で公表することを予定しております。一覧表にすることで、過去20年間における大阪府の循環型社会の進捗度合いを評価することができます。
引用文献・参考文献
- 天野 耕二, 戸辺 勝俊, 長谷川 聖洋, 日本全国の都道府県における物質循環評価手法に関する研究, 環境システム研究論文集, 2001, 29 巻, p. 215-223
- 島崎 洋一, 物流センサスによる山梨県のマテリアルフローの時系列分析, 環境科学会誌, 2008, 21 巻, 1 号, p. 27-36
English translation part is here.
Since my last post, I have been working on estimating the material flow for Osaka Prefecture for various years. In this post, I will estimate the material flow for Osaka Prefecture in 2020.
The following points highlight the differences between the 2020 estimation and the 2015 estimation:
- In the 2015 Net Logistics Survey (Logistics Census), data for internal flow could be obtained from the Excel file "Annual Inter-prefectural Flow Volume." As shown in Figure 297-1, the annual flow of agriculture, forestry, and fishery products within Hokkaido was found where the "Origin Prefecture" row for Hokkaido and the "Destination Prefecture" column for Hokkaido intersected (indicated by the blue box). In contrast, the 2020 survey split the annual data by commodity into two separate files: "Annual Shipping Volume by Prefecture/Commodity" and "Annual Arrival Volume by Prefecture/Commodity," and no dedicated file for internal flow was provided. For the 2020 internal flow, data for a 3-day period was available in the "Inter-prefectural Flow Volume (by Commodity)" file. Therefore, I calculated the annual internal flow by commodity by multiplying the "Annual Shipping Volume" (corresponding to arrival volume) by the ratio of the 3-day internal flow to the 3-day total arrival volume for that commodity.
$$
\text{Annual Internal Flow by Commodity} = \text{Annual Shipping Volume} \times \frac{\text{3-Day Internal Flow by Commodity}}{\text{3-Day Shipping Volume by Commodity}}
$$
Fig. 297-1 Annual Inter-prefectural Flow Volume (Annual by Commodity)
-
In the 2015 survey, flow volumes for all items were stored in a single Excel sheet. In the 2020 survey, however, the data was separated into individual sheets for each item.
-
To ensure that the "Flow Volume by Originating Industry/Commodity" and "Flow Volume by Receiving Industry/Commodity" reflect Osaka's actual industrial structure and transaction status, it is necessary to apply weighted corrections. These corrections use the value of raw materials, fuel, and electricity consumption for originating industries, and the value of manufactured goods shipments for receiving industries. This data is obtained from the "Economic Census for Business Activity / Tabulation by Industry (Manufacturing)." In the 2016 Economic Census, calling the API returned data as shown in Figure 297-2. However, in the 2021 Economic Census, the API returns data with extra strings in the industry names—such as year codes, region codes, and region names (e.g., "2020000000_2020_09_Food Manufacturing_00_Nationwide")—as shown in Figure 297-3. Therefore, for the 2020 estimation, it was necessary to incorporate a process into the code to remove these redundant strings.
)
Fig. 297-2 2016 Economic Census for Business Activity / Tabulation by Industry (Manufacturing)
)
Fig. 297-3 2021 Economic Census for Business Activity / Tabulation by Industry (Manufacturing)
2020 Osaka Prefecture Material Flow
The estimation results for the 2020 material flow in Osaka Prefecture are as follows:
)
Fig. 297-4 2020 Osaka Prefecture Material Flow
Regarding the indicators for material cycles, I plan to publish them in a comprehensive table once the calculations for the past 20 years (from 2000 to 2020) are complete. By creating this table, it will be possible to evaluate the progress of Osaka Prefecture toward a sound material-cycle society over the last two decades.
Citations and References
Follow me!