#295 2005年大阪府マテリアルフローの推計/Estimation of Material Flow for Osaka Prefecture, 2005
An English translation of this article is provided at the bottom of the page.
前回の投稿から、他年度における大阪府のマテリアルフロー推計に取り組んでいます。今回は2005年における大阪府のマテリアルフローを推計します。
2015年および2010年と比較して、2005年における推計は、データの取得方法が異なる印象を持ちました。例えば、港湾統計において2005年のデータはAPIを叩いて取得できるのに対して、2004年のデータはデータベース化されていないために、エクセルファイルをダウンロードして適宜加工する必要がありました。
同様に、工業統計調査もAPIを叩くのではなく、エクセルファイルをダウンロードする必要がありました。
2005年大阪府のマテリアルフロー
以下が、2005年における大阪府のマテリアルフローの推計結果になります。
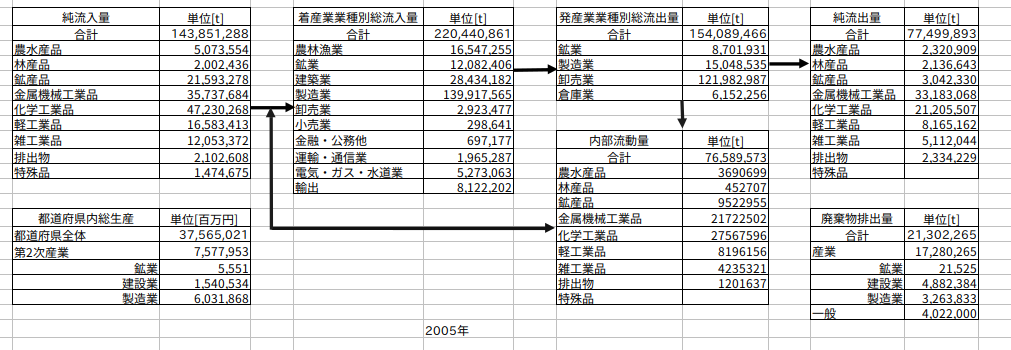
図295−1 2005年大阪府のマテリアルフロー
物質循環の指標については、2000年から2020年の過去20年での算出が全て終わった段階で一覧表にする形で公表することを予定しております。一覧表にすることで、過去20年間における大阪府の循環型社会の進捗度合いを評価することができます。
引用文献・参考文献
- 天野 耕二, 戸辺 勝俊, 長谷川 聖洋, 日本全国の都道府県における物質循環評価手法に関する研究, 環境システム研究論文集, 2001, 29 巻, p. 215-223
- 島崎 洋一, 物流センサスによる山梨県のマテリアルフローの時系列分析, 環境科学会誌, 2008, 21 巻, 1 号, p. 27-36
English translation part is here.
Since my last post, I have been working on estimating the Material Flow for Osaka Prefecture in other years. This time, I will be estimating the Material Flow for Osaka for the year 2005.
Compared to 2015 and 2010, I found that the data collection methods for the 2005 estimation were somewhat different. For example, while the 2005 data for port statistics can be retrieved via API, the 2004 data had not been converted into a database. Therefore, it was necessary to download Excel files and process them manually. Similarly, for the Census of Manufactures, I had to download Excel files instead of using an API.
Material Flow of Osaka Prefecture, 2005
The following shows the estimation results for the Material Flow of Osaka Prefecture in 2005.
)
Figure 295-1: Material Flow of Osaka Prefecture, 2005
Regarding the indicators for material cycles, I plan to publish them in a summary table once the calculations for the entire 20-year period from 2000 to 2020 are completed. By creating this summary table, we will be able to evaluate the progress of the sound material-cycle society in Osaka Prefecture over the past two decades.
Citations and References
Follow me!