#291 物質循環指標を算出する/Calculating Material Circulation Indicators
An English translation of this article is provided at the bottom of the page.
前回の投稿では、天野ら(1999)を参考に2015年大阪府内の製造業における産業別物質収支図を作成しました。
今回の投稿では、物質循環の指標を設定し、それらを算出するコードを作成していきます。
物質循環の指標
島崎(2008)は、以下の表のような物質循環の指標を用いて時系列分析を行っています。
表291−1 物質循環の指標内容(島崎(2008)より抜粋)
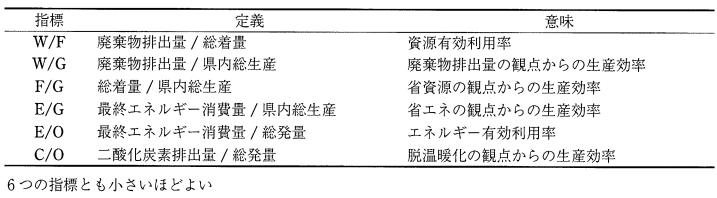
本研究では、Fを総着量ではなく、総流入量と定義した上で、
- W/F 廃棄物排出量 / 総流入量
- W/G 廃棄物排出量 / 県内総生産
- F/G 総流入量 / 県内総生産
の3つの指標について、コードを組んで算出します。
なお、算出対象となるのは、対象が大きい順に
- 都道府県全体
- 産業三大分類別(第1次産業、第2次産業、第三次産業)
- 第2次産業中の産業大分類(鉱業、建設業、製造業)
- 製造業における各産業(食料品など)
となります。
県内総生産G、廃棄物排出量W、総流入量Fのデータを用意する
県内総生産Gについては、予め2015年大阪府産業連関表から算出しておきます。算出式は、以下のようになります。
$$
県内総生産 = 粗付加価値部門計 - 家計外消費支出
$$
平成27年(2015年)大阪府産業連関表統計表の「01 取引基本表37部門(CSV:22KB)」をダウンロードします。
第1次産業と第3次産業に所属する産業は第1次産業と第3次産業に集約し、第2次産業に所属する産業は集約はしないで、そのまま産業ごとに県内総生産を算出します。
算出結果は、「産業別G.csv」というファイルに格納しておきます。
次に、廃棄物排出量Wについては、大阪府産業廃棄物処理実態調査報告書(平成26年度実績)にある「巻末資料 表2 業種別の処理・処分状況<平成26年度>(エクセル:1,211KB)」から、産業中類別の排出物排出量を引用し、「業種別産業廃棄物排出量.csv」に格納しておきます。
また、産業廃棄物実態調査報告書では、産業中類別の産業名に略称が使われています。
例えば、産業中分類では「食料品製造業」という産業名だと、略称は「食料品」というように。
そこで、産業中類別の産業名と略称の対応表である「製造業における産業名と略称の対応表.csv」を用意しておきます。
着産業別の総流入量Fは前回の投稿の時点で算出済みなので、その結果を格納したDataFrameであるdf_chaku_industryをコピーしたものを利用していきます。
物質循環の指標を算出する
第1次産業と第3次産業を集約した時点での、物質循環の指標を算出するコードは、以下のようになります。
なお、着産業において、農業、林業、漁業は「農林漁業」へ、卸売業、小売業、金融・公務他、運輸・通信業、電気・ガス・水道業、輸出は「第3次産業」への集約はコード内で実行しています。
# 産業別GのCSVファイルを読み込む
df_G = pd.read_csv('産業別G.csv', index_col=0)
df_indicator = df_G.copy()
df_indicator['W'] = 0.0
df_indicator['F'] = 0.0

# 産業別WのCSVファイルを読み込む
df_waste = pd.read_csv('業種別産業廃棄物排出量.csv', index_col=0)

# 廃棄物排出量Wをdf_indicatorに格納していく
# --- 準備:正式名称から略称を引く辞書を作る ---
# industry(正式) -> abbreviation(略)
df_abbr = pd.read_csv('製造業における産業名と略称の対応表.csv')
name_to_abbr = dict(zip(df_abbr['industry'], df_abbr['abbreviation']))

# 手動で追加した分もマージ
name_to_abbr['鉱業'] = '鉱業'
name_to_abbr['建設業'] = '建設業'

# --- データ入力ループ ---
for ind in df_indicator.index:
    if ind == '農林漁業':
        df_indicator.loc[ind, 'W'] = 0.0
    elif ind == '第3次産業':
        df_indicator.loc[ind, 'W'] = df_waste[df_waste['三大分類'] == '第3次産業']['排出量'].sum()
    else:
        # 1. 正式名称(ind)を略称(short_name)に変換
        short_name = name_to_abbr.get(ind, ind)

        # 2. 略称を使って df_waste から値を取得
        if short_name in df_waste.index:
            df_indicator.loc[ind, 'W'] = df_waste.loc[short_name, '排出量']
        else:
            print(f"⚠️ '{short_name}' (元: {ind}) が廃棄物データに見つかりません。")
            df_indicator.loc[ind, 'W'] = 0.0

df_indicator

# 廃棄物排出量Fをdf_indicatorに格納していく
# --- 1. 下準備:データのクレンジング ---
# インデックスの前後にある空白(全角・半角)を完全に除去
df_chaku_clean = df_chaku_industry.copy()
df_chaku_clean.index = df_chaku_clean.index.str.strip()

# --- 2. F列算出のためのマッピング定義 ---
# df_indicatorのインデックス名に対して、df_chaku側のどの行を足すべきかを定義します
f_mapping = {
    '農林漁業': ['農業', '林業', '漁業'],
    '第3次産業': [] # 第3次産業は別途 df_sector_chaku から計算するため空
}

# 第3次産業の集計用リスト
third_sec = ['卸売業','小売業','金融・公務他','運輸・通信業','電気・ガス・水道業','輸出']

# 3. ループ処理でF列を計算
for ind in df_indicator.index:
    # --- A. 第3次産業の場合 ---
    if ind == '第3次産業':
        total_f = 0.0
        for sec in third_sec: # ['卸売業','小売業'...]
            if sec in df_sector_chaku.index:
                total_f += df_sector_chaku.loc[sec, '総流入量']
        df_indicator.loc[ind, 'F'] = total_f

    # --- B. 農林漁業の場合 ---
    elif ind == '農林漁業':
        df_indicator.loc[ind, 'F'] = 0.0

    # --- C. それ以外の製造業・鉱業・建設業 ---
    else:
        # まずは正式名称で探す
        target_name = ind
        # なければ略称で探す
        if target_name not in df_chaku_clean.index:
            target_name = name_to_abbr.get(ind, ind)

        if target_name in df_chaku_clean.index:
            # その行の全列(全品目)を合計
            df_indicator.loc[ind, 'F'] = df_chaku_clean.loc[target_name].sum().sum()
        else:
            # それでも見つからない場合は、部分一致(業の有無など)を試みる
            matched_indices = [idx for idx in df_chaku_clean.index if target_name in idx]
            if matched_indices:
                df_indicator.loc[ind, 'F'] = df_chaku_clean.loc[matched_indices].sum().sum()
            else:
                df_indicator.loc[ind, 'F'] = 0.0

# W/F, W/G, F/Gを算出する
# 1. 単位変換:トンからグラムへ (1トン = 1,000,000g)および百万円から円へ
df_indicator['F'] = df_indicator['F'] * 1000000
df_indicator['W'] = df_indicator['W'] * 1000000

# 2. 指標の計算(ベクトル演算)
df_indicator['W/F'] = df_indicator['W'] / df_indicator['F']
df_indicator['W/G'] = df_indicator['W'] / df_indicator['G']
df_indicator['F/G'] = df_indicator['F'] / df_indicator['G']

# 3. 0除算対策:計算結果が NaN や inf(無限大)になった場所を 0.0 に置き換え
cols_to_fix = ['W/F', 'W/G', 'F/G']
df_indicator[cols_to_fix] = df_indicator[cols_to_fix].replace([np.inf, -np.inf], np.nan).fillna(0.0)

# 見やすくするために小数点以下の表示を調整
pd.options.display.float_format = '{:.3f}'.format

# 結果の確認
df_indicator[['W/F', 'W/G', 'F/G']]
引用文献・参考文献
- 天野 耕二, 戸辺 勝俊, 長谷川 聖洋, 日本全国の都道府県における物質循環評価手法に関する研究, 環境システム研究論文集, 2001, 29 巻, p. 215-223
- 島崎 洋一, 物流センサスによる山梨県のマテリアルフローの時系列分析, 環境科学会誌, 2008, 21 巻, 1 号, p. 27-36
English Translation
In my previous post, I created a material balance diagram for each industry in the manufacturing sector of Osaka Prefecture for 2015, referencing Amano et al. (1999). In this post, I will set indicators for material circulation and develop the code to calculate them.
Indicators for Material Circulation
Shimazaki (2008) conducted a time-series analysis using the material circulation indicators shown in the table below.
Table 291-1: Details of Material Circulation Indicators (Excerpt from Shimazaki (2008))
In this study, I define "F" as the "Total Inflow" rather than the total amount of arrivals. Based on this, I will develop code to calculate the following three indicators:
- W/F: Waste Generation / Total Inflow
- W/G: Waste Generation / Gross Regional Product (GRP)
- F/G: Total Inflow / Gross Regional Product (GRP)
The calculation targets, ordered from the broadest to the most specific, are:
- The entire Prefecture
- The three major industrial sectors (Primary, Secondary, and Tertiary industries)
- The main industrial classifications within the Secondary industry (Mining, Construction, and Manufacturing)
- Each specific industry within the Manufacturing sector (e.g., Food products)
Preparing Data for GRP (G), Waste Generation (W), and Total Inflow (F)
Gross Regional Product (G):
I will pre-calculate the GRP using the 2015 Input-Output Table for Osaka Prefecture. The formula is as follows:
$$
GRP = Total Gross Value Added Sector - Consumption Expenditure Outside Households
$$
I downloaded the "Table 01: Basic Transaction Table - 37 Sectors (CSV)" from the 2015 Osaka Prefecture Input-Output Table statistics. Industries belonging to the Primary and Tertiary sectors are aggregated into their respective categories. For the Secondary sector, I calculate the GRP for each industry without aggregation. The results are stored in a file named GRP_by_industry.csv.
Waste Generation (W):
Data for waste generation is cited from the "Appendix Table 2: Treatment and Disposal Status by Industry Industrial_Waste_by_Sector.csv.
Additionally, the survey report uses abbreviations for industry names in the medium-level classifications (e.g., "Food Manufacturing" is abbreviated as "Food"). Therefore, I prepared a mapping file, Manufacturing_Industry_Names_and_Abbreviations.csv, to link the full industry names with their abbreviations.
Total Inflow (F):
Since the total inflow (F) by destination industry was already calculated in my previous post, I will use a copy of df_chaku_industry, the DataFrame containing those results.
Calculating Material Circulation Indicators
The following code calculates the material circulation indicators after aggregating the Primary and Tertiary sectors. Within the code, I have implemented the aggregation of Agriculture, Forestry, and Fisheries into "Agriculture, Forestry, and Fisheries," and Wholesale, Retail, Finance/Public Service, Transport/Communications, Electricity/Gas/Water, and Exports into the "Tertiary Industry."
# Load GRP (Gross Regional Product) CSV file
df_G = pd.read_csv('GRP_by_industry.csv', index_col=0)
df_indicator = df_G.copy()
df_indicator['W'] = 0.0
df_indicator['F'] = 0.0

# Load Waste Generation (W) CSV file by industry
df_waste = pd.read_csv('Industrial_Waste_by_Sector.csv', index_col=0)

# Store Waste Generation (W) into df_indicator
# --- Preparation: Create a dictionary to map formal names to abbreviations ---
# industry (formal) -> abbreviation (short)
df_abbr = pd.read_csv('Manufacturing_Industry_Mapping.csv')
name_to_abbr = dict(zip(df_abbr['industry'], df_abbr['abbreviation']))

# Merge manually added sectors
name_to_abbr['Mining'] = 'Mining'
name_to_abbr['Construction'] = 'Construction'

# --- Data Input Loop ---
for ind in df_indicator.index:
    if ind == 'Agriculture, Forestry, and Fisheries':
        df_indicator.loc[ind, 'W'] = 0.0
    elif ind == 'Tertiary Industry':
        # Sum up waste for Tertiary Industry
        df_indicator.loc[ind, 'W'] = df_waste[df_waste['Major_Category'] == 'Tertiary Industry']['Generation'].sum()
    else:
        # 1. Convert formal name (ind) to abbreviation (short_name)
        short_name = name_to_abbr.get(ind, ind)

        # 2. Retrieve value from df_waste using abbreviation
        if short_name in df_waste.index:
            df_indicator.loc[ind, 'W'] = df_waste.loc[short_name, 'Generation']
        else:
            print(f"⚠️ '{short_name}' (Original: {ind}) not found in waste data.")
            df_indicator.loc[ind, 'W'] = 0.0

df_indicator

# Store Total Inflow (F) into df_indicator
# --- 1. Preliminary: Data Cleaning ---
# Remove leading/trailing whitespaces from index
df_chaku_clean = df_chaku_industry.copy()
df_chaku_clean.index = df_chaku_clean.index.str.strip()

# --- 2. Define mapping for F column calculation ---
# Define which rows from df_chaku should be added for each index in df_indicator
f_mapping = {
    'Agriculture, Forestry, and Fisheries': ['Agriculture', 'Forestry', 'Fisheries'],
    'Tertiary Industry': [] # Calculated separately from df_sector_chaku
}

# List for aggregating Tertiary Industry
third_sec = ['Wholesale','Retail','Finance/Public Service','Transport/Communications','Electricity/Gas/Water','Exports']

# 3. Calculate F column through loop processing
for ind in df_indicator.index:
    # --- A. Case: Tertiary Industry ---
    if ind == 'Tertiary Industry':
        total_f = 0.0
        for sec in third_sec:
            if sec in df_sector_chaku.index:
                total_f += df_sector_chaku.loc[sec, 'Total_Inflow']
        df_indicator.loc[ind, 'F'] = total_f

    # --- B. Case: Agriculture, Forestry, and Fisheries ---
    elif ind == 'Agriculture, Forestry, and Fisheries':
        df_indicator.loc[ind, 'F'] = 0.0

    # --- C. Other: Manufacturing, Mining, and Construction ---
    else:
        # First, search by formal name
        target_name = ind
        # If not found, search by abbreviation
        if target_name not in df_chaku_clean.index:
            target_name = name_to_abbr.get(ind, ind)

        if target_name in df_chaku_clean.index:
            # Sum all columns (all items) for that row
            df_indicator.loc[ind, 'F'] = df_chaku_clean.loc[target_name].sum().sum()
        else:
            # If still not found, try partial matching
            matched_indices = [idx for idx in df_chaku_clean.index if target_name in idx]
            if matched_indices:
                df_indicator.loc[ind, 'F'] = df_chaku_clean.loc[matched_indices].sum().sum()
            else:
                df_indicator.loc[ind, 'F'] = 0.0

# Calculate W/F, W/G, and F/G indicators
# 1. Unit conversion: tons to grams (1 ton = 1,000,000g) and million yen to yen
df_indicator['F'] = df_indicator['F'] * 1000000
df_indicator['W'] = df_indicator['W'] * 1000000

# 2. Indicator Calculation (Vectorized operations)
df_indicator['W/F'] = df_indicator['W'] / df_indicator['F']
df_indicator['W/G'] = df_indicator['W'] / df_indicator['G']
df_indicator['F/G'] = df_indicator['F'] / df_indicator['G']

# 3. Handle division by zero: Replace NaN and inf with 0.0
cols_to_fix = ['W/F', 'W/G', 'F/G']
df_indicator[cols_to_fix] = df_indicator[cols_to_fix].replace([np.inf, -np.inf], np.nan).fillna(0.0)

# Adjust decimal display for readability
pd.options.display.float_format = '{:.3f}'.format

# Verify results
df_indicator[['W/F', 'W/G', 'F/G']]
References
- Koji AMANO, Katsutoshi TOBE, Masahiro HASEGAWA; Evaluation method of regional material balace of Japanese prefecture, Journal of Environmental Systems Research, 2001, Vol. 29, p. 215-223
- Yoichi SHIMAZAKI; Time-series Analysis of Material Flow in Yamanashi Prefecture using Physical Distribution Data, Journal of Environmental Science , 2008, Vol. 21, No. 1, p. 27-36
Follow me!