#198 2000年兵庫県における移輸入量及び移輸出量の分析
今回の投稿は、2000年兵庫県における移輸入量および移輸出量の分析についてです。
2000年兵庫県における資源の移輸入量の内訳
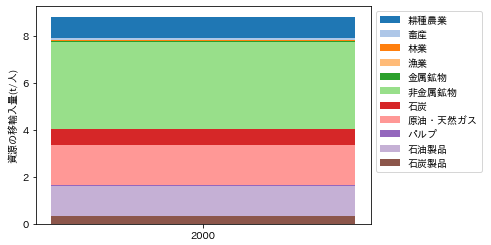
2000年兵庫県における資源の移輸入量の総量は、8.83t/人でした。業種別内訳を積み上げ棒グラフに描画するPythonのコードは、以下のようになります。
コード198-1 2000年兵庫県における資源の移輸入量内訳を推計
# 2000年兵庫県の資源の移輸入量を積み上げ棒グラフにする

# 資源に該当する産業の業種分類表のcsvファイルをDataFrame形式で読み込む
df_h12_reind = pd.read_csv("h12resourceindustries.csv")
fourcodeindex(df_h12_reind)

# 列「移輸入(資源)」を新規追加
df_h12_reind["import_re"] = 0
# code毎の資源の移輸入量を算出
import_code = "9450"   # 移輸入の産業コード
for icode in df_h12_reind.index:
    df_h12_reind.loc[icode, "import_re"] = -(df_h12_per_cap_mt.loc[icode][import_code])

# 資源に該当する業種分類表のcsvファイルをDataFrame形式で読み込む
df_h12_rese = pd.read_csv("h12resourcesectors.csv", index_col=0)

# df_h12_reindを業種別にグループ化した各グループの移輸入量を転記
for sector_ in df_h12_rese.index:
    for i, group in df_h12_reind.groupby("sector"):
        if sector_ == i:
            df_h12_rese.loc[sector_, "import_re"] = group["import_re"].sum()

# 積み上げ棒グラフの描画
fig, ax = plt.subplots(1, 1)

re_sectors = df_h12_rese.index   # 資源に該当する業種リスト
re_sector_number = len(re_sectors)   # 資源に該当する業種の数

colorlist1 = []   # 資源に該当する業種のカラーを格納するリストを用意

for i, re_sector_ in enumerate(re_sectors):
    # i行目から最終行までの和を計算
    values = df_h12_rese.iloc[i:re_sector_number, :].sum()
    colorlist1.append(cmap(i))   # 業種i番目の色をリストに格納
    ax.bar("2000", values, color=cmap(i), label=re_sector_)

ax.set_ylabel("資源の移輸入量(t/人)")
ax.legend(bbox_to_anchor=(1, 1));
描画結果は、以下のようになります。

図198-1 2000年兵庫県における資源の移輸入量
非金属鉱物が最も多く、次いで原油・天然ガスとなっています。
2000年兵庫県における資源の移輸出量内訳を推計
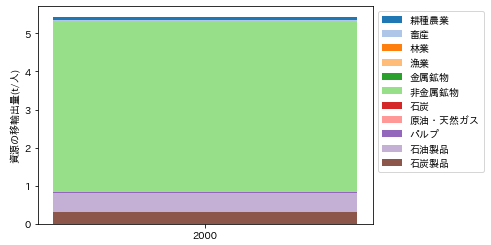
2000年兵庫県における資源の移輸出量の総量は、5.50t/人でした。業種別内訳を積み上げ棒グラフに描画するPythonのコードは、以下のようになります。
コード198-2 2000年兵庫県における資源の移輸出量内訳を推計
# 2000年兵庫県の資源の移輸出量を積み上げ棒グラフにする

df_h12_rese["color"] = None   # 列colorを新規追加
for i in range(len(colorlist1)):
    df_h12_rese.iat[i, 1] = colorlist[i]
df_h12_rese = df_h12_rese.rename(columns={"import_re": "export_re"})
df_h12_rese["export_re"] = 0

# 列「移輸入(資源)」を新規追加
df_h12_reind["export_re"] = 0
# codeごとの資源の移輸出量を算出
export_tuple = ("9220", "9230",)   # 移輸出の産業コードをタプルに格納
for icode in df_h12_reind.index:
    for export_code in export_tuple:
        df_h12_reind.loc[icode, "export_re"] = df_h12_per_cap_mt.loc[icode][export_code]

# df_h12_reindを業種別にグループ化した各グループの移輸出量を転記
for sector_ in df_h12_rese.index:
    for i, group in df_h12_reind.groupby("sector"):
        if sector_ == i:
            df_h12_rese.loc[sector_, "export_re"] = group["export_re"].sum()

# 積み上げ棒グラフの描画
fig, ax = plt.subplots(1, 1)

re_sectors = df_h12_rese.index   # 資源に該当する業種リスト
re_sector_number = len(re_sectors)   # 資源に該当する業種の数

for i, re_sector_ in enumerate(re_sectors):
    # i行目から最終行までの和を計算
    values = df_h12_rese.iloc[i:re_sector_number, 0].sum()
    ax.bar("2000", values, color=df_h12_rese.iat[i, 1], label=re_sector_)

ax.set_ylabel("資源の移輸出量(t/人)")
ax.legend(bbox_to_anchor=(1, 1));
積み上げ棒グラフは、以下のようになります。

図198-2 2000年兵庫県における資源の移輸出量
殆どが非金属鉱物で占められています。次いで石油製品、石炭製品の順になっています。
2000年兵庫県における製品の移輸入量内訳を推計
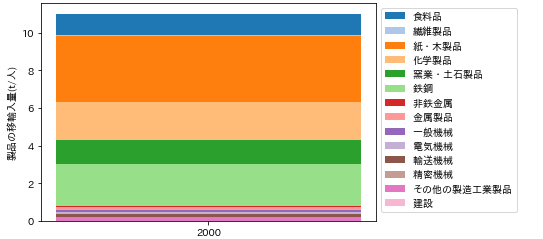
2000年兵庫県における製品の移輸入量の総量は、11.01t/人でした。業種別内訳を積み上げ棒グラフに描画するPythonのコードは、以下のようになります。
コード198-3 2000年兵庫県における製品の移輸入量内訳を推計
# 2000年兵庫県における製品の移輸入量を積み上げ棒グラフに描画する

# 製品に該当する産業の業種分類表のcsvファイルをDataFrame形式で読み込む
df_h12_goind = pd.read_csv("h12goodsindustries.csv")
fourcodeindex(df_h12_goind)

# 列「移輸入(製品)」を新規追加
df_h12_goind["import_go"] = 0
# code毎の資源の移輸入量を算出
import_code = "9450"   # 移輸入の産業コード
for icode in df_h12_goind.index:
    df_h12_goind.loc[icode, "import_go"] = -(df_h12_per_cap_mt.loc[icode][import_code])

# 製品に該当する業種分類表のcsvファイルをDataFrame形式で読み込む
df_h12_gose = pd.read_csv("h12goodssectors.csv", index_col=0)

# df_h12_goindを業種別にグループ化した各グループの移輸入量を転記
for sector_ in df_h12_gose.index:
    for i, group in df_h12_goind.groupby("sector"):
        if sector_ == i:
            df_h12_gose.loc[sector_, "import_go"] = group["import_go"].sum()

# 積み上げ棒グラフの描画
fig, ax = plt.subplots(1, 1)

go_sectors = df_h12_gose.index   # 製品に該当する業種リスト
go_sector_number = len(go_sectors)   # 資源に該当する業種の数

colorlist2 = []   # 資源に該当する業種のカラーを格納するリストを用意

for i, go_sector_ in enumerate(go_sectors):
    # i行目から最終行までの和を計算
    values = df_h12_gose.iloc[i:go_sector_number, :].sum()
    colorlist2.append(cmap(i))
    ax.bar("2000", values, color=cmap(i), label=go_sector_)

ax.set_ylabel("製品の移輸入量(t/人)")
ax.legend(bbox_to_anchor=(1, 1));
積み上げ棒グラフは、以下のようになります。

図198-3 2000年兵庫県における製品の移輸入量
紙・木製品が最も多く、次いで鉄鋼となっています。
2000年兵庫県における製品の移輸出量内訳を推計
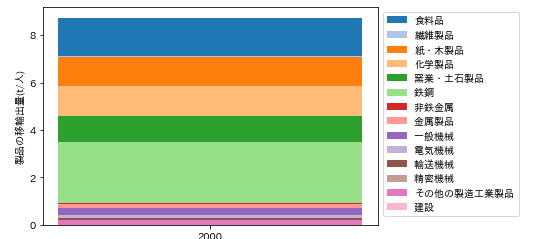
2000年兵庫県における製品の移輸出量の総量は、9.71t/人でした。業種別内訳を積み上げ棒グラフに描画するPythonのコードは、以下のようになります。
コード198-4 2000年兵庫県における製品の移輸出量の内訳を推計
# 2000年兵庫県の製品の移輸出量を積み上げ棒グラフにする

df_h12_gose["color"] = None   # 列colorを新規追加
for i in range(len(colorlist2)):
    df_h12_gose.iat[i, 1] = colorlist2[i]
df_h12_gose = df_h12_gose.rename(columns={"import_go": "export_go"})
df_h12_gose["export_go"] = 0

# 列「移輸入(製品)」を新規追加
df_h12_goind["export_go"] = 0
# codeごとの資源の移輸出量を算出
export_tuple = ("9220", "9230",)   # 移輸出の産業コードをタプルに格納
for icode in df_h12_goind.index:
    for export_code in export_tuple:
        df_h12_goind.loc[icode, "export_go"] = df_h12_per_cap_mt.loc[icode][export_code]

# df_h12_goindを業種別にグループ化した各グループの移輸出量を転記
for sector_ in df_h12_gose.index:
    for i, group in df_h12_goind.groupby("sector"):
        if sector_ == i:
            df_h12_gose.loc[sector_, "export_go"] = group["export_go"].sum()

# 積み上げ棒グラフの描画
fig, ax = plt.subplots(1, 1)

go_sectors = df_h12_gose.index   # 資源に該当する業種リスト
go_sector_number = len(go_sectors)   # 資源に該当する業種の数

for i, go_sector_ in enumerate(go_sectors):
    # i行目から最終行までの和を計算
    values = df_h12_gose.iloc[i:go_sector_number, 0].sum()
    ax.bar("2000", values, color=df_h12_gose.iat[i, 1], label=go_sector_)

ax.set_ylabel("製品の移輸出量(t/人)")
ax.legend(bbox_to_anchor=(1, 1));
積み上げ棒グラフは、以下のようになります。

図198-4 2000年兵庫県における製品の移輸出量
鉄鋼が最も多く、次いで食料品となっています。


