#138 2013年(平成25年)大阪府産業連関表における生産額の推計値と統計値の比較
前回(#137)の投稿まで、2013年(平成25年)大阪府産業連関表の生産額の推計を行ってきました。
今回の投稿は、生産額の推計値と公表されている平成25年大阪府延長産業連関表の生産額(以下、「統計値」と記載)の比較についてです。
Tachibana et al.(2008)における生産額の推計値と統計値の比較
In order to evaluate the accuracy of the material flow analysed in this study, we compared the domestic productions of the I–O table constructed on the basis of the official I–O table for 1995 with the values of the official I–O table for 2000. The result of this comparison is shown in Fig. 2. The X-axis represents the domestic productions of each industry of the official I–O table, and the Y-axis represents that of the I–O table constructed in this study. The coefficient of correlation between the estimated values and the values obtained from statistical analysis is greater than 0.9. This suggests that our method is highly accurate. The plots in Fig. 2 show a two-digit classification of the industries. We, however, performed calculations on the basis of a three-digit classification and summed up the results on the basis of a two-digit classification.
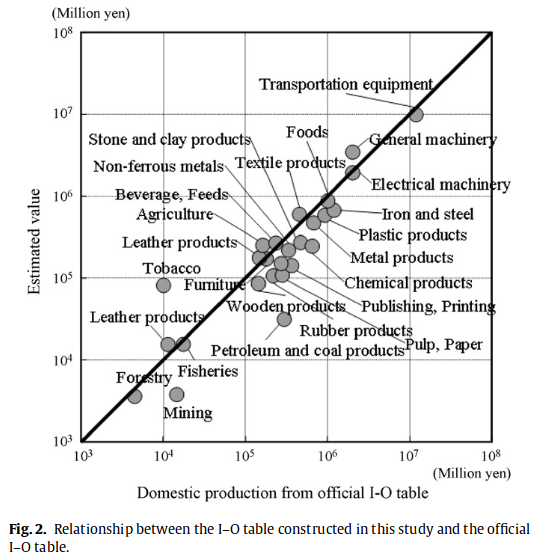
Junzo Tachibana, Keiko Hirota, Naohiro Goto, Koichi Fujie. A method for regional-scale material flow and decoupling analysis: A demonstration case study of Aichi prefecture, Japan. Resources Conservation and Recycling 2008;52:1382-1390より文章と図(Fig.2.)を引用
Tachibana et al.(2008)と同じようにして、2013年(平成25年)大阪府における生産額の推計値と統計値を比較していきます。
本研究における府内生産額の推計値と統計値の比較
LibreOffice Calcで散布図を作図
まずは、統合小分類(190部門)での比較です。以下の散布図はLibreOffice Calcで作成したものになります。
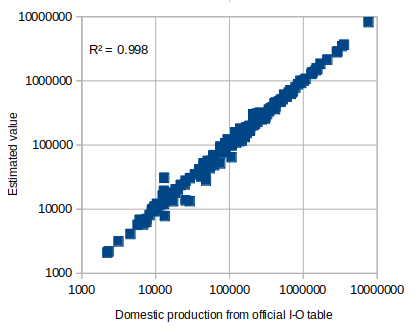
Fig.138-1. Relationship between the I-O table constructed in this study and the official I-O table
色々ツッコミどころ満載ですね^^;
- X軸とY軸の値の単位(Million yen)が抜けている
- X軸とY軸の目盛りが指数表示になっていない
- 直線(y=x)が描かれていない
- そもそも、プロットされている部門数が190と多すぎる
といったあたりがツッコミどころでしょうか。
ただ、相関係数(correlation coefficient)については、$$R^2 = 0.998$$となっていることが唯一の救いですね^^;
相関係数が0.9を超えているので、#137まで行ってきた生産額の推計について、推計方法の精度が高いと言えるのではと考えています。
部門数を統合
上述のように、統合小分類(190部門)だとプロット数が多すぎるので、部門統合を行います。
本研究では製造業のマテリアルフローを分析することに主眼をおいているので、製造業に関しては統合中分類で、製造業以外の産業については、統合大分類による部門分類で整理することにします。
最終的に、産業部門数は44部門となりました。
jupyter notebookで散布図を描写するための準備
次に、jupyter notebookで散布図を書くことに挑戦してみました。
まず、結合小分類(190部門)における府内生産額の推計値と統計値のCSVファイルを読み込みます。
import pandas as pd
# csvファイルを読み込む
df_190 = pd.read_csv('2013relationship_between_estimated_and_official.csv', index_col=['code'])
df_190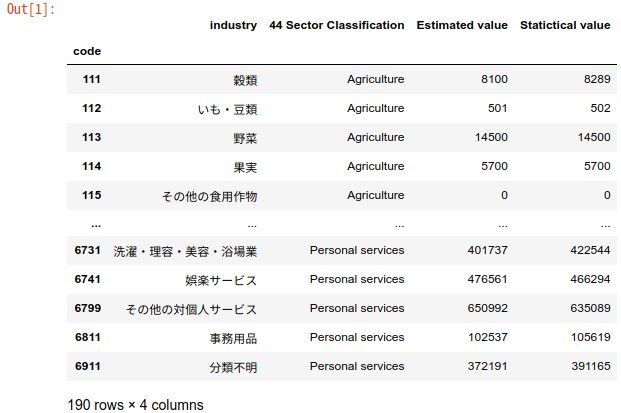
Fig.138-2. df_190
次に、44部門で集約してみます。
# 44部門で推計値、公表値を集約する
df_44 = df_190.groupby('44 Sector Classification').agg(
        {'Estimated value': 'sum',
         'Statictical value': 'sum'})
df_44.head()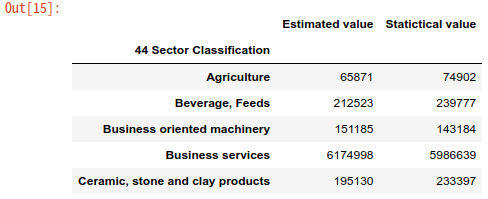
Fig.138.3. Aggregated Sector's estimated and statictical value
これでようやく44部門での推計値と統計値の散布図を描く準備ができました。
jupyter notebookで散布図を描画
## 44部門での散布図を描く
%matplotlib inline
import matplotlib.pyplot as plt
import seaborn as sns
import numpy as np

# 図の大きさを縦:4,横:5に、解像度(デフォルトは100)を指定
plt.figure(figsize=(4, 4), dpi=200)

# 統計値をx軸に、推計値をy軸に、点の大きさと透過度を指定して、散布図を描写
plt.scatter(df_44['Statictical value'], df_44['Estimated value'], s=10, alpha=0.5)

# x軸とy軸の名称を指定
plt.xlabel('Domestic production from official I-O table')
plt.ylabel('Estimated value')

# 軸の最大値を10000000、最小値を100に変更
plt.xlim(1000, 100000000)
plt.ylim(1000, 100000000)

# 軸目盛を対数目盛に変更
plt.xscale('log')
plt.yscale('log')

# 目盛線を表示
plt.grid()

# 直線y=xを引く
x = np.linspace(1000, 100000000)
y = x
plt.plot(x, y)

# 散布図を保存する
plt.savefig('scatter.png')
上記のコードは、以下のサイトを参考に書かせて頂きました。
YutaKaのPython教室
【Python入門】plot関数でグラフを作成してみよう!
散布図は、以下のようになりました。
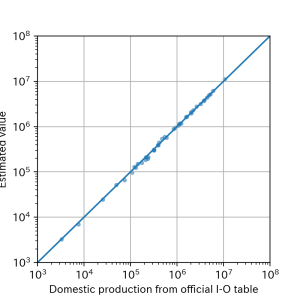
Fig.138.4. Relationship between estimated value and statictical value
うーん。
まだ、
- X軸とY軸の値の単位(Million yen)が抜けている
- 各プロットの産業名が表記されていない
といった改善点はありますが、LibreOffice Calcで描いたものに比べれば、Tachibana.et al.(2008)のFig.2.にかなり近づいたかと。
というわけで、府内生産額の推計値と統計値の比較はここまでにして、次回の投稿から、2013年(平成25年)大阪府産業連関表の作成作業に戻ることにします。


“#138 2013年(平成25年)大阪府産業連関表における生産額の推計値と統計値の比較” に対して1件のコメントがあります。